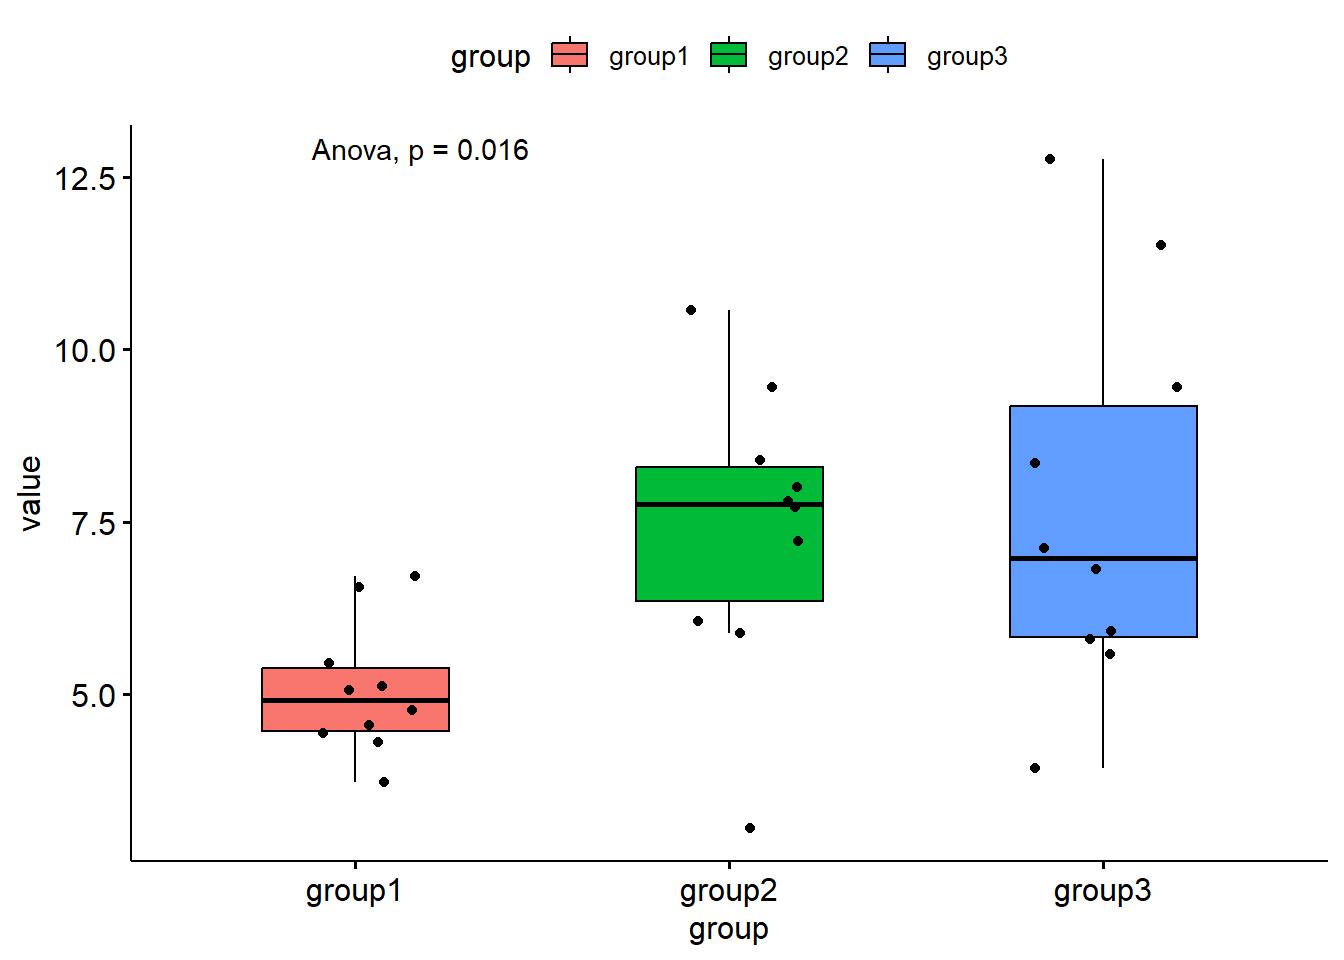
# Install ggpubr packagelibrarian::shelf(ggpubr, tidyr, quiet =TRUE)# Create some dummy dataset.seed(123)group1 <-rnorm(10, mean =5, sd =1)group2 <-rnorm(10, mean =7, sd =2)group3 <-rnorm(10, mean =9, sd =3)# Combine the data into a data framedata <-data.frame(group1, group2, group3) %>%pivot_longer(cols =everything(), names_to ="group")# Note that ggpubr works for tidy data, hence using pivot_longer()# Create the plotplot <-ggboxplot(data,x ="group",y ="value",width =0.5,fill ="group",add ="jitter") +stat_compare_means(method ="anova")print(plot)
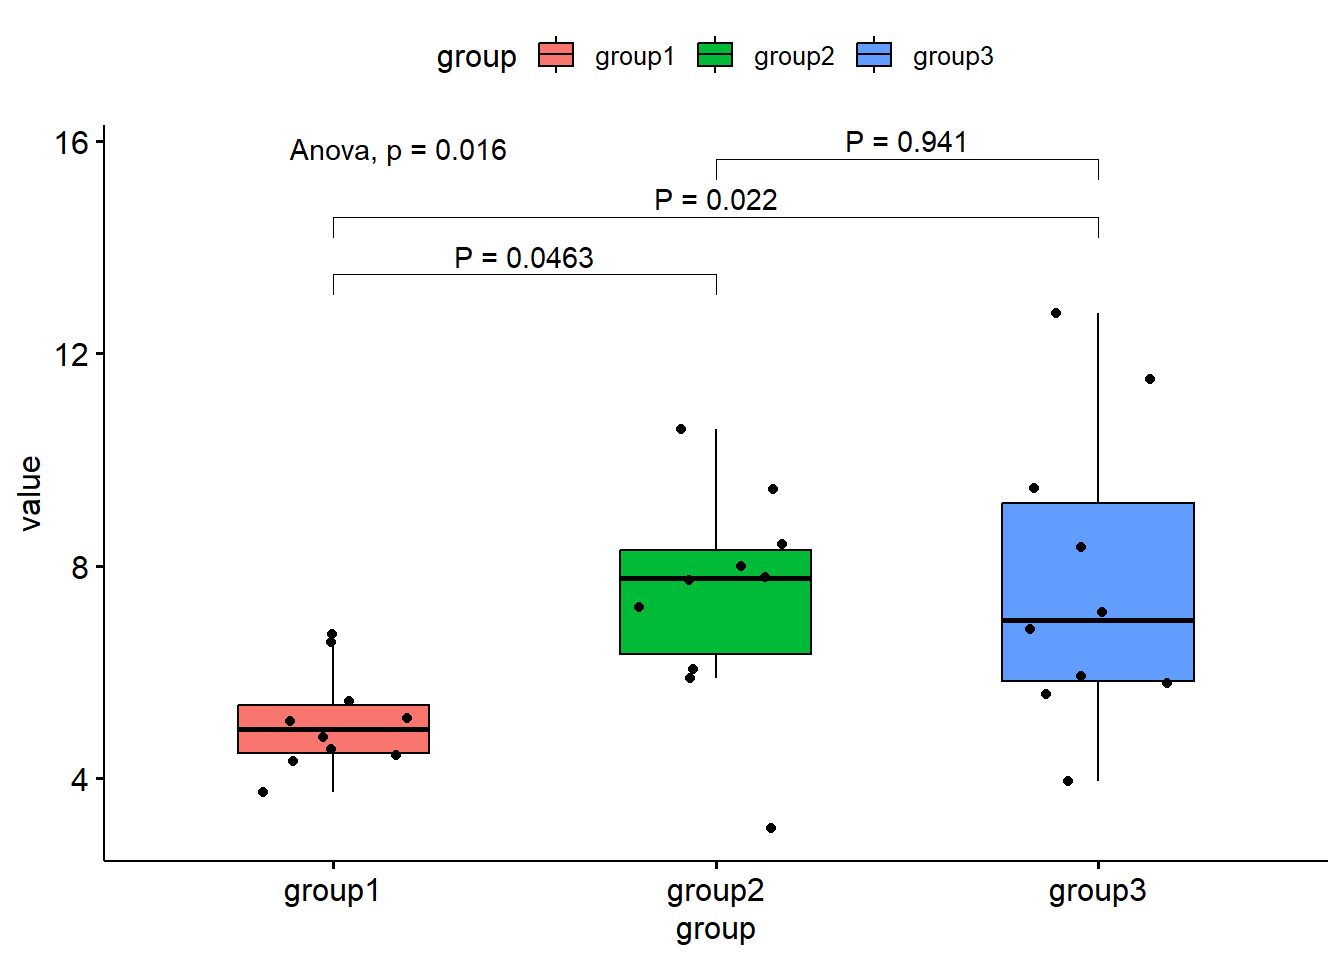
Now let’s add some brackets:
# Note that ggpubr seems to also load rstatixlibrarian::shelf(rstatix, quiet =TRUE)# Here is how you can add brackets with P values in your plot:aov_results <-anova_test(value ~ group, data = data)
Warning in summary.lm(mod, corr = FALSE): partial argument match of 'corr' to
'correlation'
if (aov_results$p <=0.05) { tukey_test <-tukey_hsd(data, value ~ group) %>%add_y_position() plot +stat_pvalue_manual(tukey_test, label ="P = {p.adj}")}
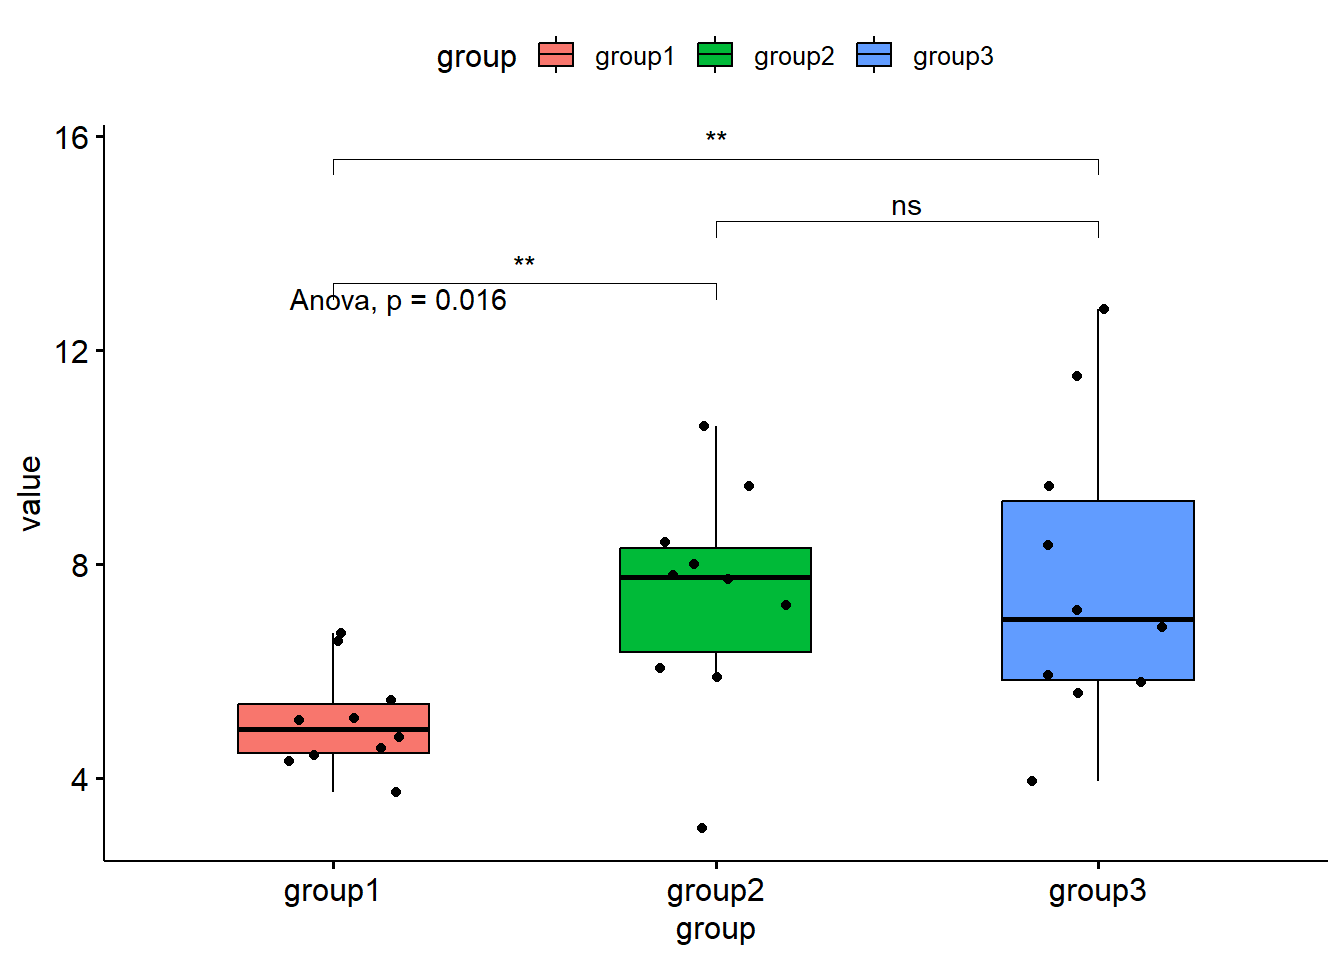
# Note that it is recommended to use an italic *P* in uppercase. I don't think# this is possible in an R code, so a simple uppercase P should suffice. However# now the problem is that the automatic p for the anova test is in lowercase.# Alternatively with P symbols (not recommended anymore):# From ?stat_compare_means()symnum.args <-list(cutpoints =c(0, 0.0001, 0.001, 0.01, 0.05, Inf),symbols =c("****", "***", "**", "*", "ns") )# Brackets for anova would not work, so you need another testmy_comparisons <-list(c("group1", "group2"), c("group2", "group3"), c("group1", "group3"))plot +stat_compare_means(method ="wilcox.test", comparisons = my_comparisons, symnum.args = symnum.args)
[1] FALSE
# Note that the following code doesn't work:aov_results <-anova_test(value ~ group, data = data) %>%tukey_hsd() %>%add_y_position()# Instead, don't start from anova and use the test directly:tukey_test <-tukey_hsd(data, value ~ group) %>%add_y_position()